graph8 for Campaign Manager
A field guide for Campaign Manager. Live URLs, real surfaces. Screenshots captured from a showcase tenant with public-company data only.
The five things to use today
01. Campaign Studio — 30 campaigns, each with 17 generated docs
graph8 doesn’t make you build a campaign from scratch. Open Campaign Studio, pick a wedge, and you get the brief + messaging + targeting + sequence + cadence + ad copy + LP + QA rubric all generated. You edit, you don’t author.
Open it at
app.graph8.com/studio?mode=campaign— Campaign Studio list view- Click any campaign → 17-doc workspace
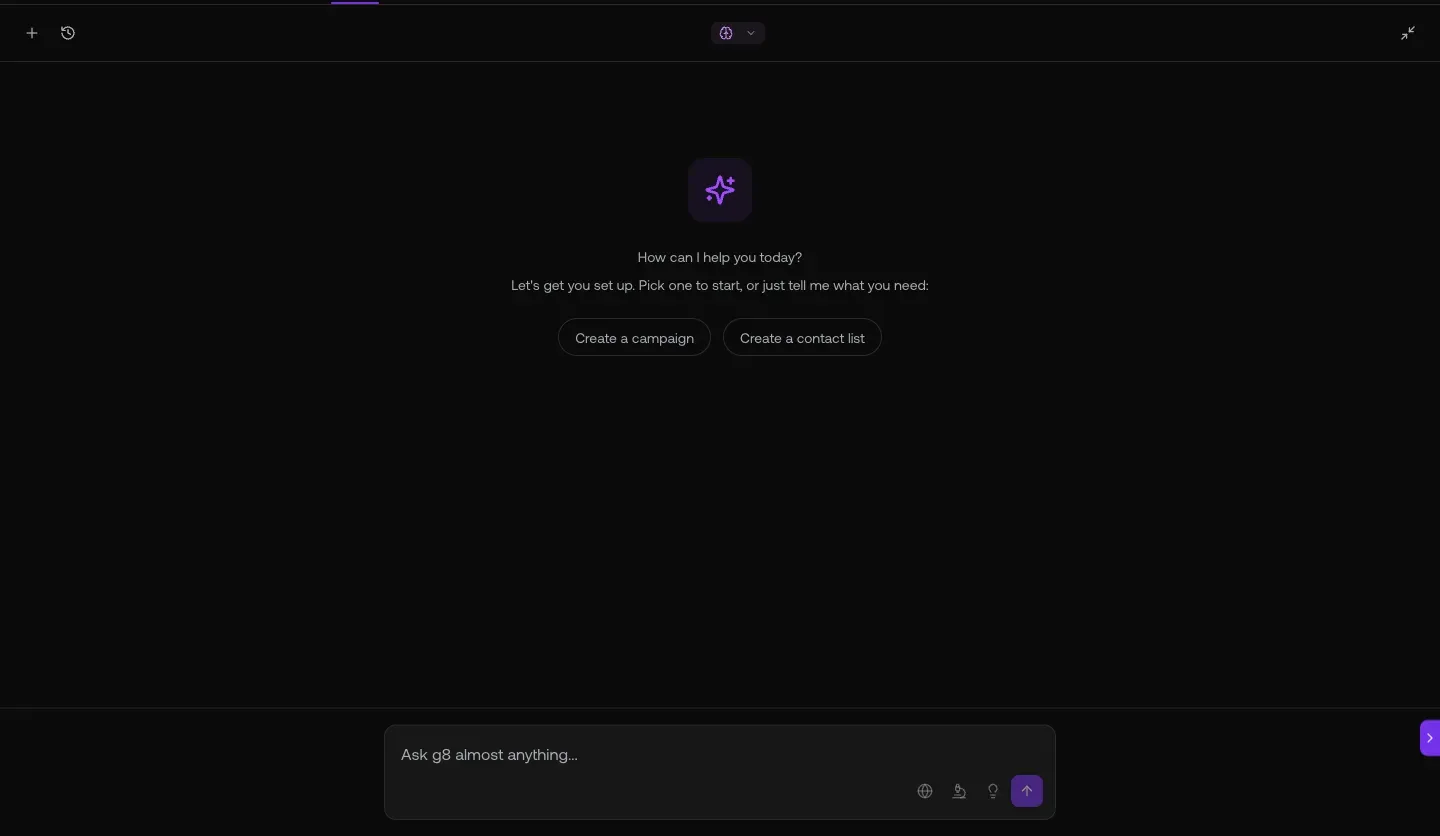
Fig 1.1 — /studio?mode=campaign. 30 campaigns live including The Broken Stack Benchmark · SalesLeaders · GrowthDemandGen · SDR Headcount · TaylorHaren PostEng · a paying customer series · Spreadsheet · New CRO/VP Sales.
The 17 auto-generated campaign documents
- Dashboard
- Landing Pages
- Campaign Brief
- Messaging & Objections
- Targeting & Routing
- Email Prompt
- Emails
- Call Script
- Voicemail
- LinkedIn Copy
- Social Prompt
- Sequence
- Cadence Calendar
- Performance Tracker
- QA Rubric
- Reply Templates
- Snippets
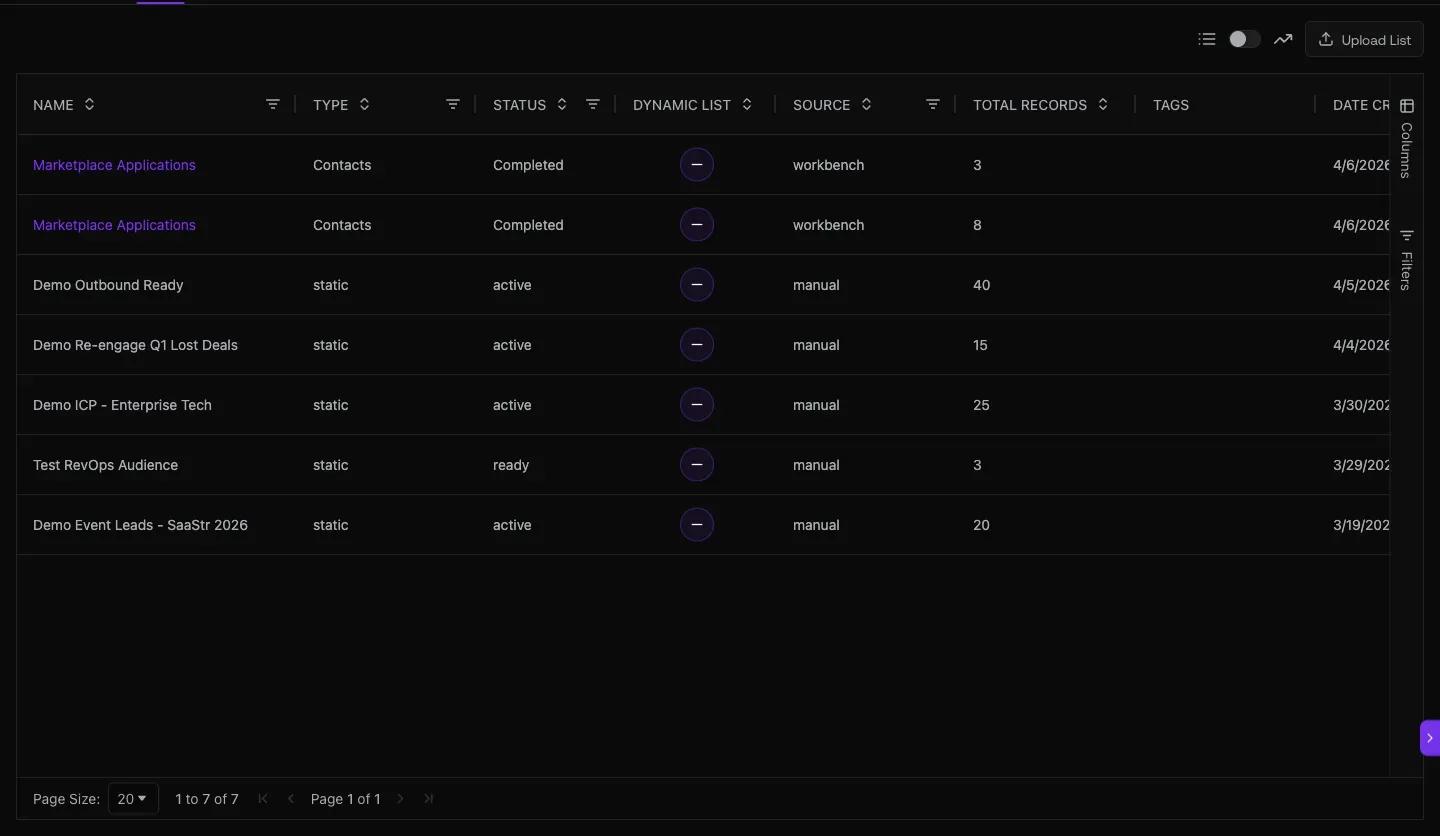
Fig 1.2 — The Broken Stack Benchmark campaign with full doc sidebar. Readiness 82. Progress chips: Content · Sequence · Edit Copy · Audience · Launch. Click any doc in the sidebar to read/edit.
02. Sequencer — 30 team sequences with per-step performance
Each campaign has a sequence behind it. The Sequencer shows per-step Progress %, Contacts at this step, Schedule, Replies. Kill underperforming steps in isolation; clone the winners.
Open it at
app.graph8.com/sequencer— Personal / Team / Archived tabs
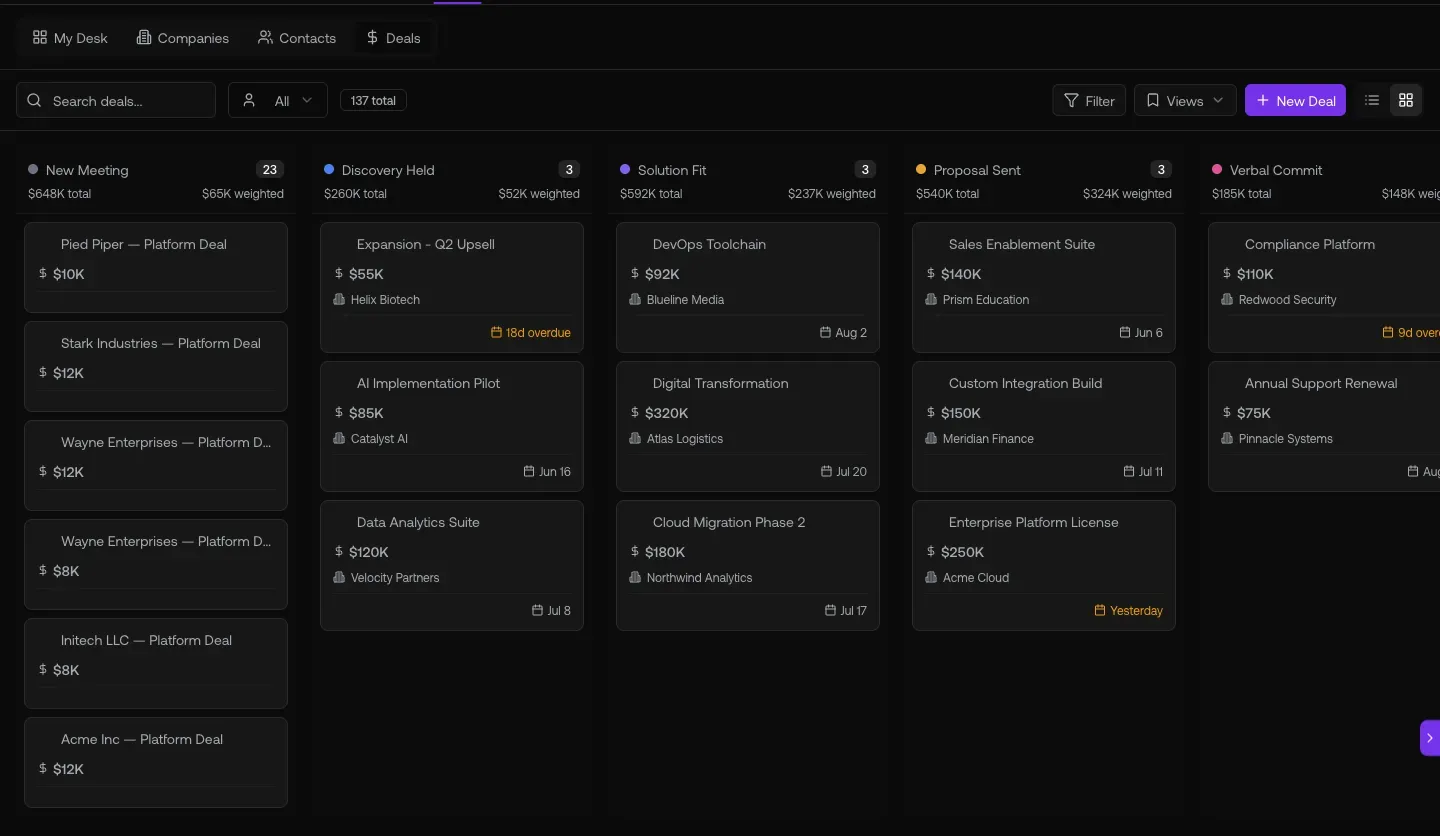
Fig 2.1 — Sequencer Team tab. 30 sequences with channels / contacts / steps / status columns. Live ones include Multi-Channel Sequence Test · SalesLeaders_AI&ML · GrowthDemandGen · TaylorHaren · Ari · Graph8_linkedin_testing · SDR/BDR · RevOps · VP/Head-Sales · DecisionMakers_Startups.
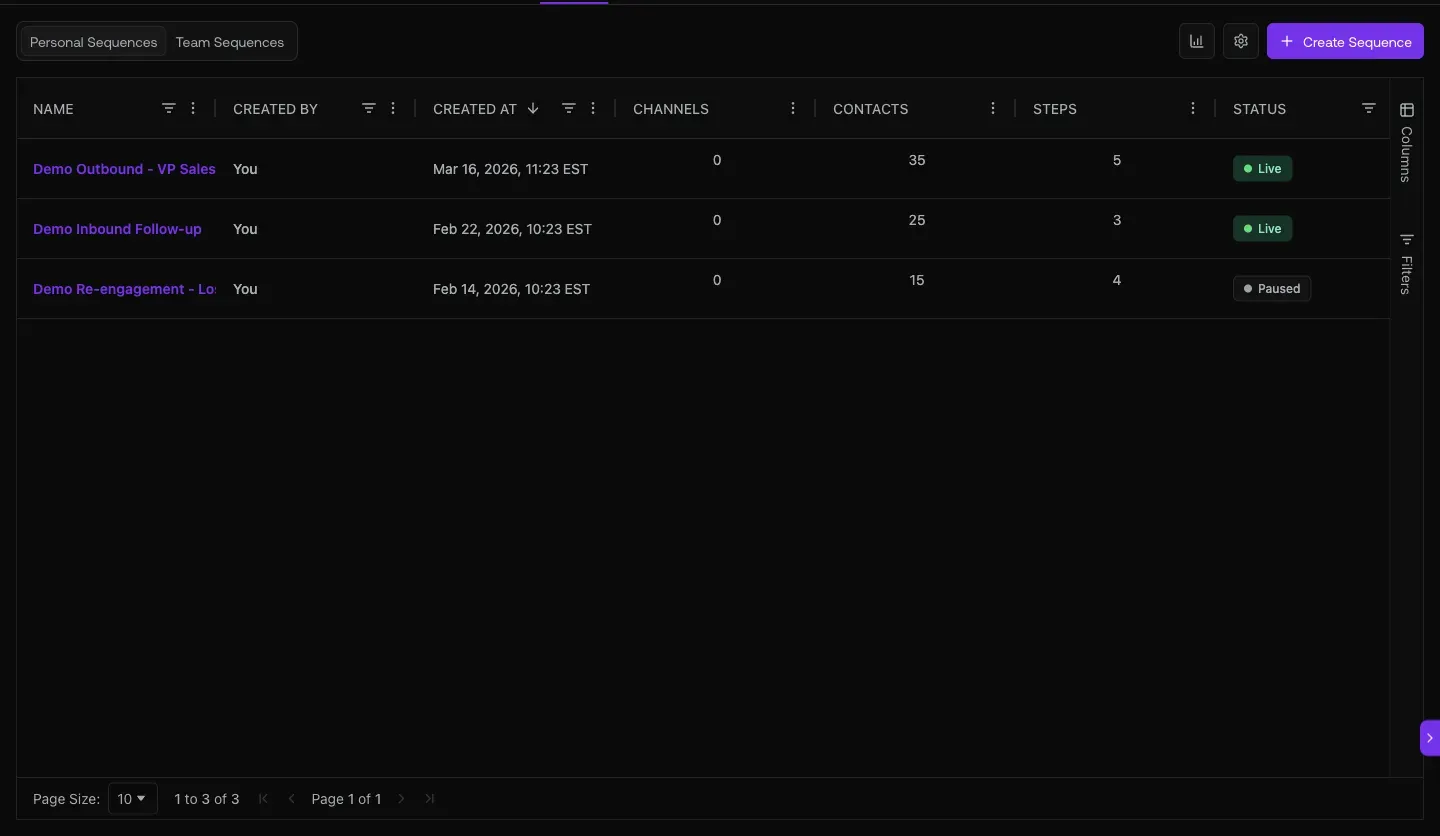
Fig 2.2 — RevOps_SaaS sequence detail: many contacts · 3,937 active · 3 steps. Per-step cards show Progress / Contacts / Sent / Replied / Bounced / Scheduled / Failed. Progress percentages over 100% (676% / 735%) mean the step has cycled the contact pool more than once.
03. Paid channels + landing pages — every wedge gets a click destination
A campaign isn’t complete without an ad and a landing page. graph8 ships both: 6-step ad wizard for Meta/LinkedIn/Google/X, plus 41 published LPs with template library (Bold Hero, Benefits Grid, Social Proof First, ROI Calculator, etc.).
Open it at
app.graph8.com/ads— Create Campaign wizard/studio?mode=content&ct=landing_page— Landing Pages list (19 drafts + 41 published)
Fig 3.1 — /ads wizard. 6 steps. 4 platforms. LinkedIn pre-selected for B2B campaigns. Each platform needs a one-time Connect Account before audience push-out.
04. Reply triage with sequence attribution + conversion tracking
Every reply lands in the Inbox tagged with which campaign it came from. Sentiment chips tell you what kind of reply. Conversions analytics rolls up form submissions + meetings booked.
Open it at
app.graph8.com/inbox/email— sentiment + sequence-attribution chips per reply/analytics/conversions— Goal Completions (Form Submission + Meeting Booked)/forms— 19 forms with target-list mappings (lead capture endpoints)
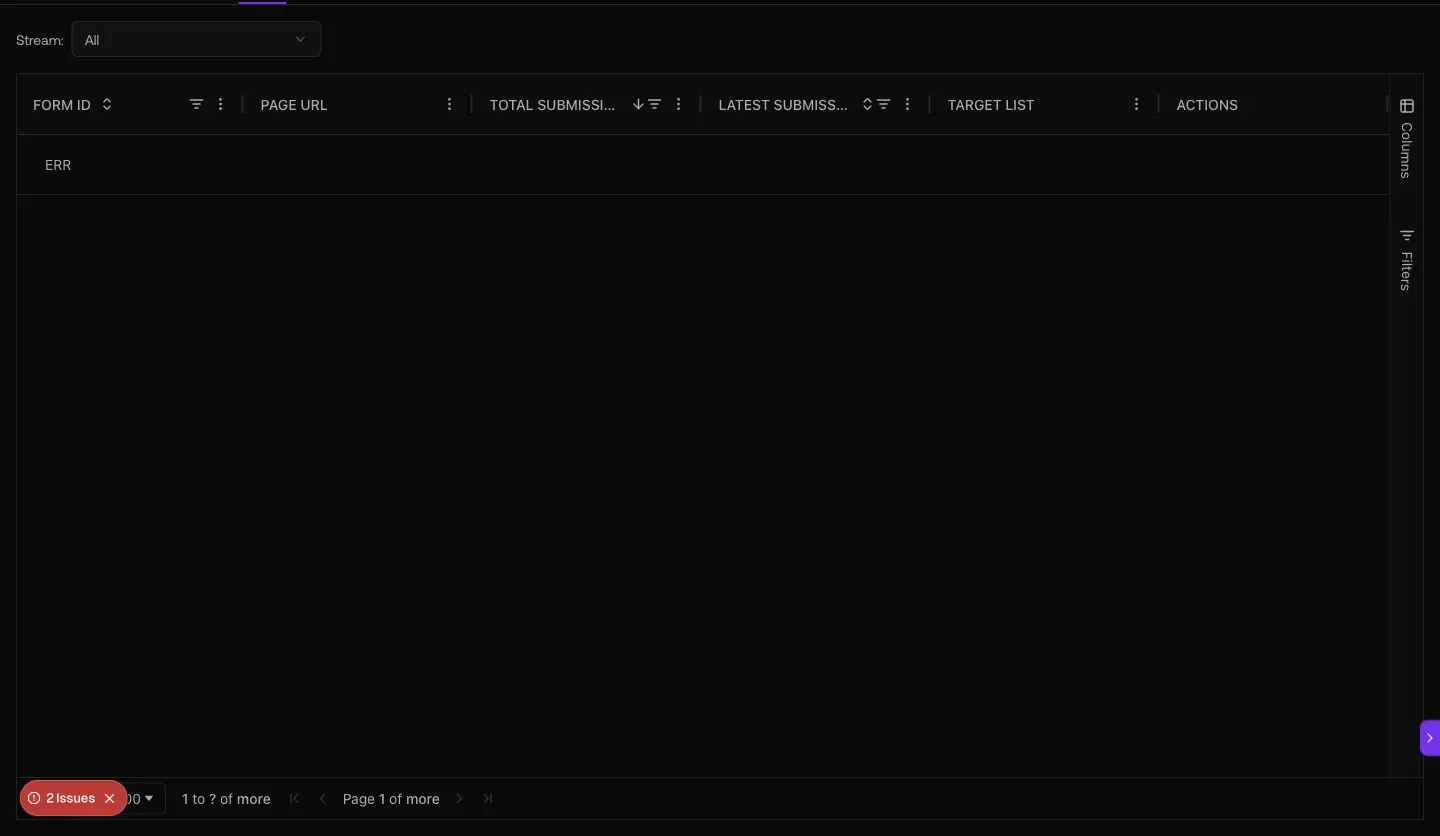
Fig 4.2 — /analytics/conversions. 148 conversions · 108 form submissions · 40 meetings booked. Two goals tracked.
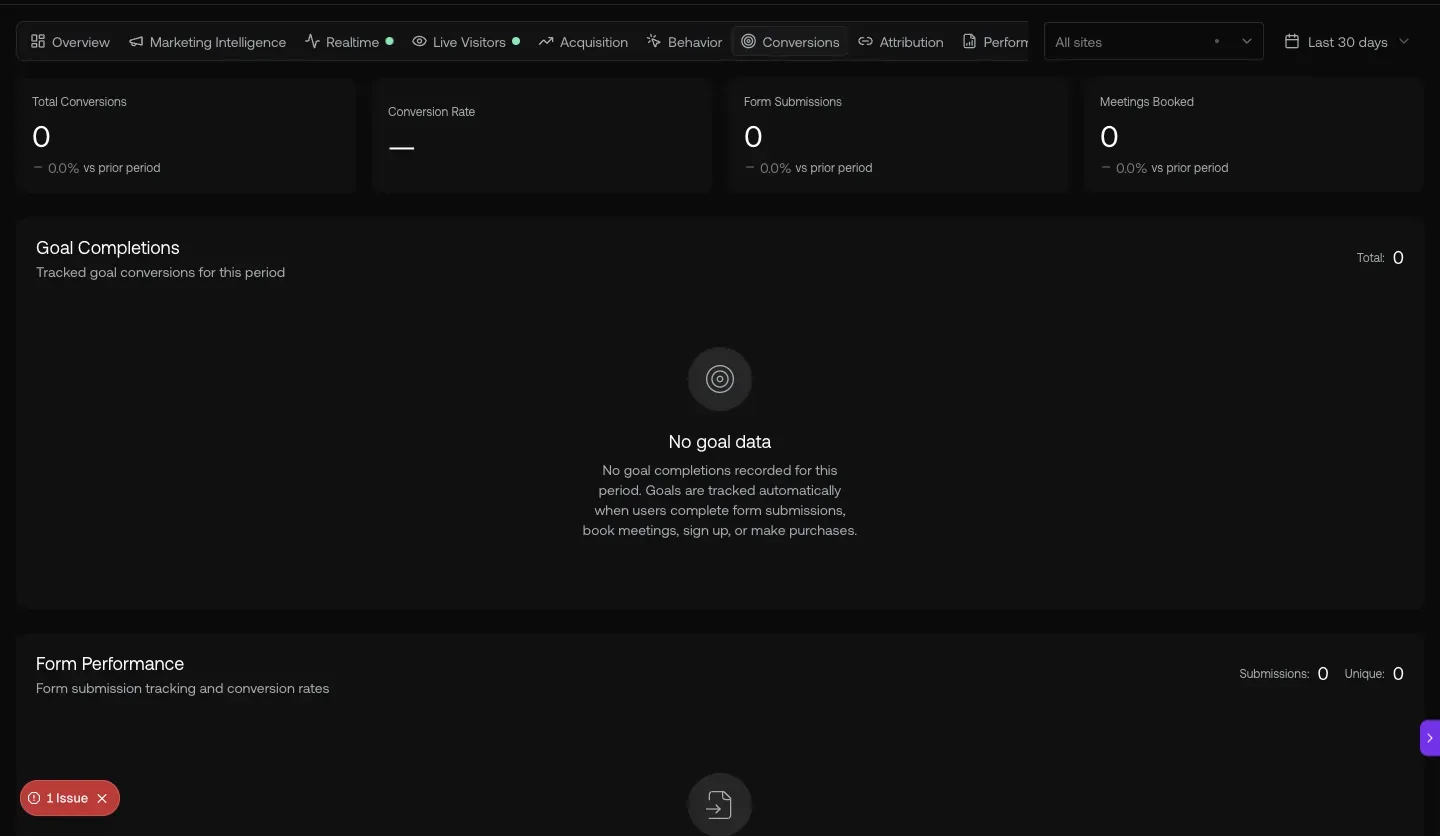
Fig 4.3 — /forms. 19 forms across graph8.com + a paying customer.com properties. Each form has a Target List that routes new submitters into a sequence — the lead-capture-to-outbound seam.
05. Copilot — ask which campaign is winning, get a structured answer
Natural-language campaign performance queries. The copilot returns structured tables comparing reply rates, send volume, and per-segment performance across all live campaigns.
Open it at
- Sparkle icon · top-right · any page → Copilot side panel
- Also reachable from WhatsApp / Slack / iMessage / Roam via the Bridge (see
/profile?tab=apps)
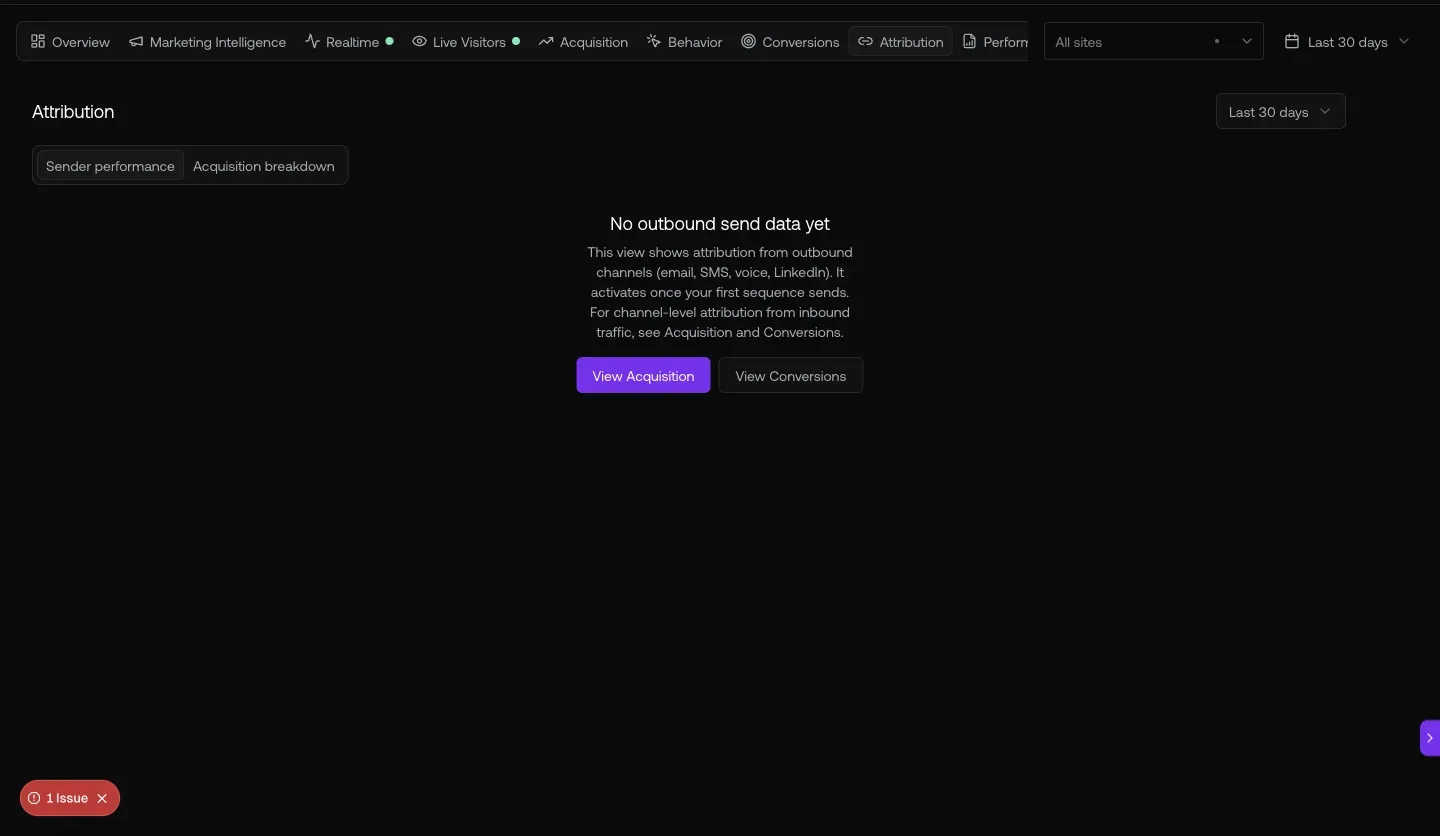
Fig 5.1 — Live copilot response. Q: “Which campaign has the best reply rate?” A: SalesLeaders_AI&ML at 0.41% (5 replies / 1,215 sent) + analysis comparing AI/ML targeting to broader SaaS segments. The copilot reads from the same data the Performance Reports use.
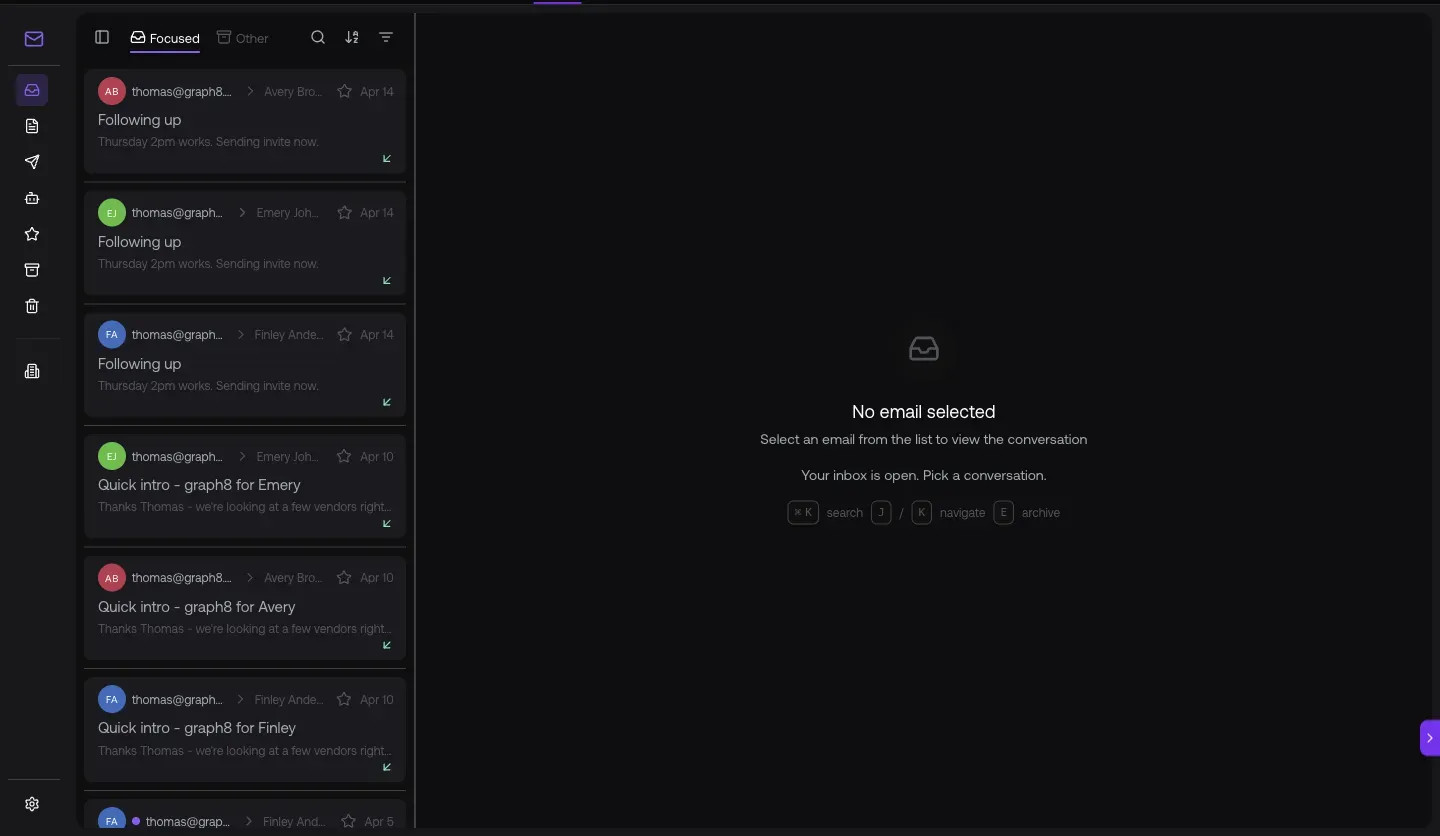
Fig 5.2 — /analytics/acquisition. Channel mix the campaign drives traffic into: 80.6K users · Direct 90% · Organic 6% · Referral 4% · AI/LLM 0%. Watch this rebalance when you launch paid ad campaigns.
URL cheat-sheet
| To do this | Go here |
|---|---|
| Campaign list (30 active) | /studio?mode=campaign |
| Open campaign — 17 docs | Click any row in Campaign Studio |
| Team sequences | /sequencer → Team tab |
| Sequence detail (per-step perf) | Click any sequence row |
| Ad campaigns (6-step wizard) | /ads |
| Landing Pages (19 drafts · 41 published) | /studio?mode=content&ct=landing_page |
| Reply triage with attribution | /inbox/email |
| Conversions (forms + meetings) | /analytics/conversions |
| Acquisition channels | /analytics/acquisition |
| Form submissions + target lists | /forms |
| Marketing Intelligence + Bridge Funnel | /analytics/marketing |
| Open Copilot anywhere | Sparkle · top-right |
Heads-up — known Campaign Manager gaps
Generated 2026-05-20 against
app.graph8.com (org your org). Surface state verified live before publication